AI Slide-Ready Tables Made Easy: 10 Plug-and-Play Prompts for MACg Users
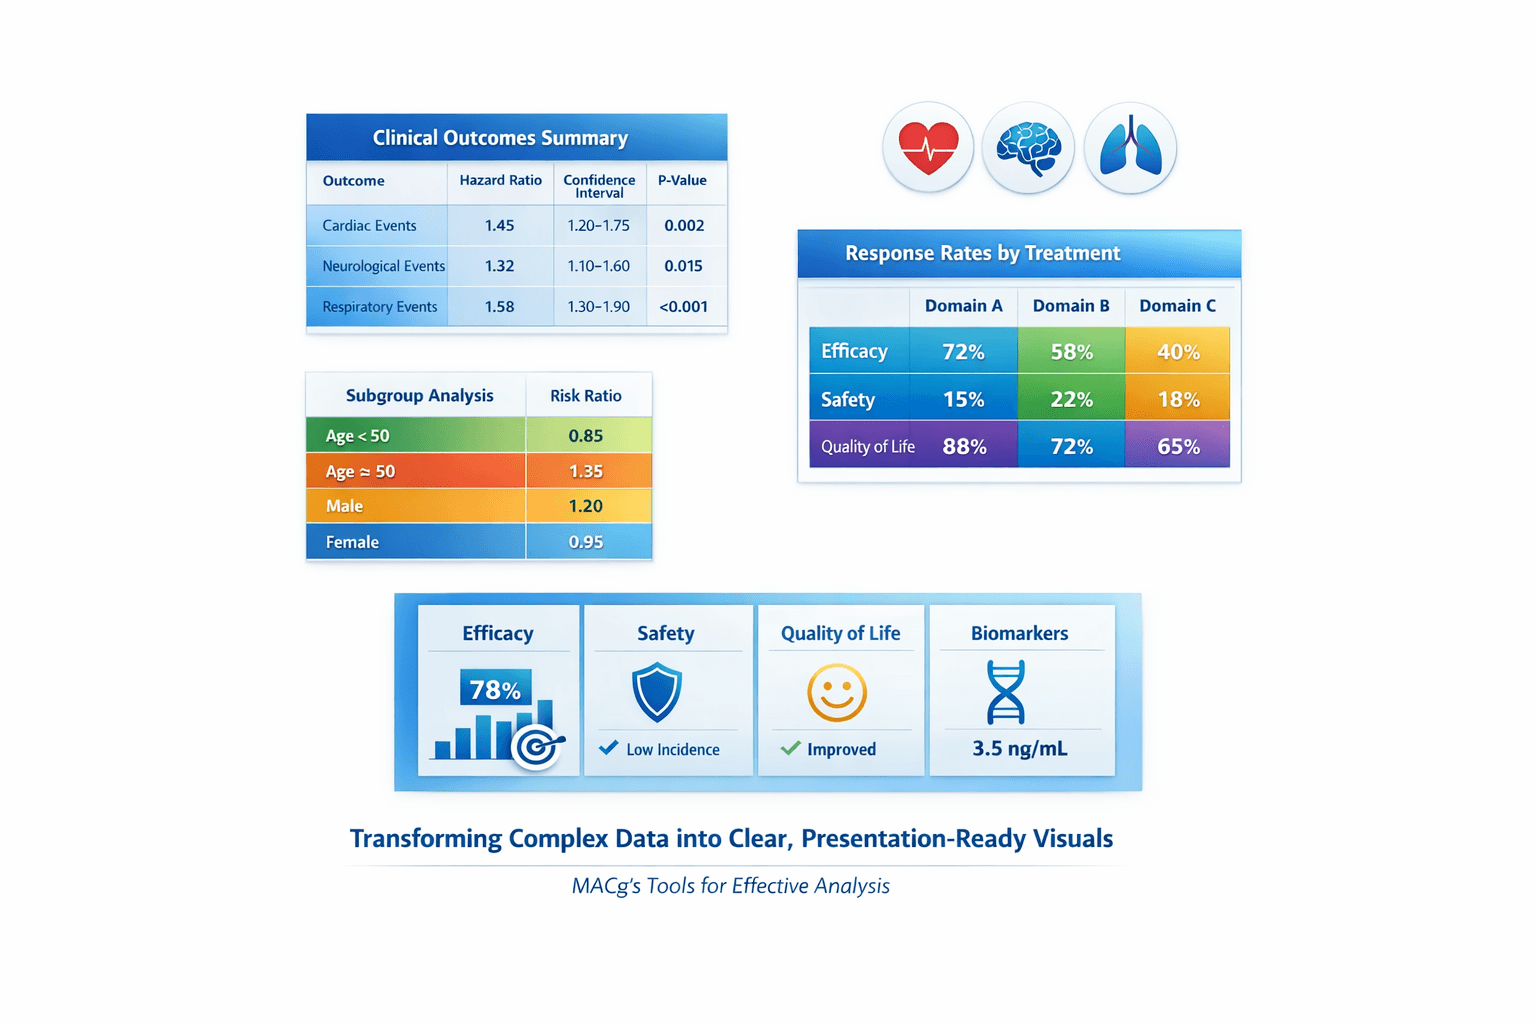
This article is a practical guide for MACg users who want to create beautiful, slide-ready tables from clinical and scientific data. It explains why the first slide output doesn't need to be perfect and shows how to iterate like a pro using MACg's image generator and flexible slide builder. The core of the article is a set of 10 copy‑pasteable prompt templates for different table styles, from primary outcomes and safety summaries to subgroup grids and multi-domain overviews. It also emphasizes attaching or pasting datasets so MACg can generate accurate, presentation-ready visuals.
Many MACg users feel frustrated when their first slide isn't quite right—but that's normal. Instead of stopping there, approach it like a pro: use MACg's powerful image generator and flexible slide builder to iterate toward exactly what you want. MACg can produce beautiful, slide-ready tables from your clinical or scientific data; the key is knowing how to ask and how to feed it the right input. This article gives you 10 ready‑to‑use prompt patterns you can copy, paste, and adapt. Each one is:
- Designed for any study or dataset
- Optimized for slides, reports, and infographics
- Built so you just swap in your own directions (replace ALL‑CAPS placeholders)
How to Use These Prompts with MACg
1. Always Give MACg the Data Source
To get accurate, slide-ready tables, MACg needs to “see” your data. Whenever you use any of the prompts below:
Attach the study or information MACg should use for the table.
For example: upload the PDF, Word file, slide deck, CSR excerpt, or data table.
If the dataset is not too large, you can paste the data directly into the prompt.
For example: copy the key rows from a results table or a summary of numeric values.
You can do this in two main ways:
- Attach a file and reference it
“Use the attached Phase 3 DAPA-HF manuscript, Table 2, as the data source.”
- Inline data in the prompt
“Using the following data, create the table: [paste short table or list of endpoints and numbers].”
The more clearly MACg can see the numbers and labels, the better the table will match your study.
2. Customize the Prompt
Before you paste any of the templates:
- Replace STUDY OR DATASET NAME (or similar) with your actual study/program name.
Adjust any comments about colors, icons, or branding to match your slide template.
If using inline data, add it after the style instructions, for example:
“Here is the data to use for the table: [PASTED DATA].”
3. Refine After the First Draft
- Once MACg creates a first version, you can refine it:
Content tweaks:
“Shorten the endpoint labels.”
“Remove less important endpoints and keep only the top three.”
Visual tweaks:
“Use more muted colors.”
“Increase spacing between rows for easier reading on a projector.”
Here are the 10 PROMPT Templates
1. Gradient Comparison Table (Primary Outcomes)
Best for:
-High‑impact primary/major secondary outcomes
-“Hero” slide early in the deck
What this table does:
-Shows treatment vs comparator for key primary endpoints
-Uses a soft horizontal gradient (e.g., light teal → deep blue)
-Highlights the most important row visually
Copy‑paste prompt (remember to attach or paste your data):
Create a slide-ready infographic-style data table with a soft horizontal gradient background blending two professional colors [for example, light teal to deep blue]. Show a compact comparison of primary outcomes for STUDY OR DATASET NAME. Use column headers: Endpoint, Treatment group, Comparator group, Difference, 95% CI, p-value. Fill the table with the key endpoints and numeric results extracted from the source document, keeping labels short and clinical. Highlight the most important primary endpoint row using a slightly deeper shade or subtle glow. Use clean sans-serif fonts, large and readable, with centered text in each cell and generous white space. The layout should be wide in landscape format, optimized for a presentation slide, with full frame, no cropping, all text fully visible, and margin padding around the edges. Use the attached study or the dataset included below as the source for endpoints and numeric values. If a dataset is provided inline, base the table strictly on that data.
Pro tip:
After attaching or pasting your data, add: “Reorder rows so the most clinically meaningful endpoint is first.”
2. Icon-Enhanced Outcomes Table (Efficacy + PROs)
Best for:
-Slides combining clinical outcomes with patient‑reported outcomes
-Making PROs feel as important as hard endpoints
What this table does:
-Integrates efficacy + PROs in one place
-Adds small icons to signal domain (heart, brain, lung, patient)
-Uses interpretable, short labels
Copy‑paste prompt:
Generate a high-resolution infographic table that combines clinical outcomes and patient-reported outcomes for STUDY OR DATASET NAME. Use a clean white background with colored column headers that follow the brand or theme colors. Include columns: Outcome, Measure, Treatment result, Comparator result, Interpretation. For each row, place a small minimalist icon next to the outcome name that suggests its domain, such as a heart for cardiovascular outcomes, a brain for CNS outcomes, a lung for respiratory outcomes, or a patient silhouette for quality of life. Use concise outcome labels and populate the cells with numeric values and brief interpretations drawn from the text. Apply rounded cell corners, thin grid lines, and a balanced layout designed for clear viewing in a slide deck. Ensure full frame, no cropping, all text fully visible, and margin padding around the edges. Use the attached study document or the inline dataset provided in this prompt as the source of all outcomes, measures, and numeric values.
Pro tip:
If you pasted a mixed efficacy/PRO table, follow up with: “Group similar outcomes together and keep only 5–7 of the most important rows.”
3. Color-Coded Subgroup Grid
Best for:
-Subgroup analyses currently shown in dense forest plots or long tables
-Communicating “no major heterogeneity” or “which groups benefit more”
What this table does:
-Shows subgroups by row
-Uses colors and arrows to indicate direction and magnitude
-Adds a legend for non‑statisticians
Copy‑paste prompt:
Create a visually engaging subgroup results table for STUDY OR DATASET NAME that shows how the treatment effect varies across key subgroups. Use a light neutral background and color-coded cells to indicate effect size or direction, such as green for greater benefit, yellow for similar benefit, and grey for minimal difference. Include columns: Subgroup, Treatment effect vs comparator, 95% CI or range, Direction vs overall effect. Populate rows with subgroups like age categories, sex, geographic regions, disease severity levels, or biomarker-defined groups. Use arrows or simple symbols in the Direction column to indicate larger, similar, or smaller effects compared with the overall result. Add a small, clear legend explaining the colors and symbols. Use a modern, clinical style with wide landscape layout, full frame, no cropping, all text fully visible, and margin padding around the edges. Base all subgroup effects and confidence intervals on the attached subgroup results (for example, from a forest plot or table) or on the inline subgroup dataset included in this prompt.
Pro tip:
When you attach a forest plot, say: “Extract the subgroup names and treatment effects from the attached figure and convert them into this table format.”
4. Safety Top-Line + Detail Table
Best for:
-Safety overview slides where you need both headline safety and top events
-Side‑by‑side with efficacy for benefit–risk discussions
What this table does:
-Splits safety into a bold top‑line row and detailed events
-Uses restrained color but clear structure
-Keeps percentages aligned and legible
Copy‑paste prompt:
Design a clean, slide-ready safety summary table for STUDY OR DATASET NAME. Use a two-level structure: a bold top-line safety row followed by detailed adverse event rows. Add columns: Safety parameter, Treatment group %, Comparator group %. In the top-line section, include overall measures such as Any adverse event, Serious adverse event, Discontinuation due to adverse event, and Death. Below that, list the most common specific adverse events with their percentages. Use subtle icons in the first column if desired, such as a small warning triangle for serious events, while maintaining a professional medical look. Apply a restrained color palette with a slightly darker band for the top-line row and lighter bands for detailed rows. Ensure legible typography, clear alignment, and a layout optimized for projection, with full frame, no cropping, all text fully visible, and margin padding around the edges. Derive all safety parameters and percentages from the attached safety table or from the adverse event dataset pasted below in this prompt.
Pro tip:
If your source table is very long, add: “Limit detailed adverse events to the 8–10 most frequent or clinically important events.”
5. Rounded-Corner “Study Card” Table
Best for:
-“At a glance” study overview slides
-First or second slide in a study section of a deck
What this table does:
-Creates a card‑like block with design and baseline together
-Uses two vertical panels: design on left, baseline data on right
Copy‑paste prompt:
Create a rounded-corner “study card” style table that summarizes the core design and baseline characteristics for STUDY OR DATASET NAME. The table should look like a single information card with a soft drop shadow. Split the card into two vertical panels. On the left, present short bullet-style rows for key design elements such as study type, phase, randomization ratio, duration, number of participants, number of sites, and main inclusion criteria. On the right, include a mini-table with column headers such as Parameter, Treatment group, Comparator group, listing baseline variables like age, disease duration, and relevant clinical scores. Use brand or theme accent colors for headers, minimalist icons for design elements, and clear, large fonts that are easy to read in a meeting room. Keep the composition wide and balanced, with full frame, no cropping, all text fully visible, and margin padding around the edges. Extract all design and baseline information from the attached protocol, manuscript, or slide deck, or from the concise dataset you paste into this prompt.
Pro tip:
When copying text from a protocol, you can say: “Condense long inclusion criteria into a single short bullet-style row.”
6. Before/After Table (Baseline vs Follow-up)
Best for:
-Showing change over time (e.g., biomarker levels, scores, response rates)
-Slides paired with a line or bar chart
What this table does:
-Compares baseline vs follow‑up by group
-Emphasizes change from baseline numerically
Copy‑paste prompt:
Generate a minimalist before-and-after numeric table that displays change over time for one or more outcomes in STUDY OR DATASET NAME. Use columns: Group, Baseline mean, Follow-up mean, Change from baseline. Include rows for each treatment or comparison group. Style the table with a white or very light background, subtle horizontal separators, and only minimal color accents in the group labels. Keep outcome names short and position the table so it could be placed beside a chart on a slide. Focus on clarity and readability with large, clean fonts and a spacious layout. Full frame, no cropping, all text fully visible, centered layout, and margin padding around the edges. Use baseline and follow-up values taken directly from the attached results table or from the compact dataset that you paste into this prompt.
Pro tip:
Paste only the relevant outcome(s) and timepoints, then say: “Ignore other timepoints and focus only on baseline and the primary follow-up visit.”
7. Pooled vs Individual Study Results Table
Best for:
-Study programs, pooled analyses, meta‑analyses
-Explaining how individual trials compare to an overall result
What this table does:
-Lists each study as a row, plus a pooled row
-Uses banded rows and emphasizes the pooled effect
Copy‑paste prompt:
Create a compact comparison table showing individual and pooled results for key outcomes across multiple studies or analyses within STUDY PROGRAM OR DATASET GROUP. Use columns: Dataset, Treatment effect vs comparator, 95% CI, p-value. Add rows for each individual study and an additional row for the pooled or meta-analytic result. Use banded rows and emphasize the pooled result row with slightly stronger color or bold type. Maintain consistent numeric formatting and align all values neatly. This table should communicate reproducibility and overall effect at a glance, in a wide landscape layout suitable for slides, with full frame, no cropping, all text fully visible, and margin padding around the edges. Base all effect sizes, confidence intervals, and p-values on the attached pooled analysis table or on the multi-study dataset that you paste into this prompt.
Pro tip:
If your source includes several outcomes, specify: “Use only the primary efficacy outcome for each study in this table.”
8. Compact “Icon-Ready” Summary Table
Best for:
-Busy slides where you only have room for a few key messages
-Summary slide at the end of a section
What this table does:
Reduces the study to a few core measures
Leaves space for icons or annotations in your slide software
Copy‑paste prompt:
Design a very compact, minimalist summary table to capture the main findings from STUDY OR DATASET NAME in just a few rows. Use columns: Key measure, Summary result. Examples of rows could include primary outcome, key secondary outcome, safety overview, and a patient-reported outcome. Keep the text short and numerical when possible, such as relative risk, mean difference, or responder percentages. Use a single accent color for the header row with the rest of the table on a white background, leaving space around the table so icons, checkmarks, or arrows can be added in presentation software. Optimize for clarity on a single slide, with full frame, no cropping, all text fully visible, and margin padding around the edges. Choose the key measures and results from the attached study summary, manuscript, or dataset pasted into this prompt, prioritizing the most clinically relevant findings.
Pro tip:
After attaching your document, say: “Pick only one efficacy, one safety, and one PRO result to keep this table extremely concise.”
9. Multi-Domain “Block” Table (Efficacy, Safety, PROs)
Best for:
-Slides that must present benefit–risk + PROs together
-Executive summaries
What this table does:
-Organizes data into three visually distinct blocks: Efficacy, Safety, PROs
-Keeps a unified, clean style across all domains
Copy‑paste prompt:
Generate a multi-domain block-style data table that summarizes results from STUDY OR DATASET NAME across several domains. Organize the rows into three clearly separated blocks labeled Efficacy, Safety, and Patient-reported outcomes, each with its own subtle background tint. Use columns: Domain, Endpoint, Treatment group result, Comparator group result, Difference or effect size, p-value. Populate each block with concise endpoint names and numerical results from the source document. Ensure distinct visual separation between the domain blocks while maintaining a unified, modern style. Use a wide landscape format ideal for slides, with full frame, no cropping, all text fully visible, and margin padding around the edges. Use the attached efficacy, safety, and PRO tables or the structured dataset pasted into this prompt to populate each block, selecting the most clinically meaningful endpoints.
Pro tip:
When you paste multiple tables, add: “Select 3–4 key endpoints per domain rather than listing everything.”
10. Stepwise-Reveal Endpoint Hierarchy Table
Best for:
-Live presentations where you reveal one endpoint at a time
-Explaining the hierarchy of endpoints and control of type I error
What this table does:
Orders endpoints from primary to exploratory
Creates clean row spacing for stepwise animation
Copy‑paste prompt:
Create a presentation-ready data table for STUDY OR DATASET NAME that shows the hierarchy of primary and key secondary endpoints in a format suitable for stepwise animation. Use columns: Level, Endpoint, Result (treatment vs comparator), p-value. Order the rows from primary endpoints at the top to secondary and exploratory endpoints below. Design the table with clear horizontal separation and sufficient vertical spacing between rows so that each row can be revealed one at a time during a talk. Apply a neutral base color and a subtle highlight style that makes the active row stand out when discussed. Use simple, bold, slide-legible typography and a clean, clinical aesthetic, with full frame, no cropping, all text fully visible, and margin padding around the edges. Derive the list of endpoints, their hierarchy, and their results from the attached protocol, statistical analysis plan, or results table, or from the concise endpoint list and numeric results pasted into this prompt.
Pro tip:
If your hierarchy is described only in text, add: “Interpret the description of endpoint hierarchy in the attached document and convert it into ordered rows in the table.”
Final Tips for MACg Users
Always attach or paste your data.
- MACg will give you much better tables when it can see your actual endpoints and numbers.
Start from the closest template.
- Need safety? Use the Safety Top‑Line + Detail Table.
- Need an overview? Use the Study Card or Compact Summary.
- Need benefit–risk? Pair Multi‑Domain Block with Safety Top‑Line.
Iterate rather than aiming for perfection in one step.
- First run: full prompt + attached/pasted data.
Then refine: shorter labels, fewer rows, color tweaks, spacing for live projection.
Creating visually engaging, slide-ready tables doesn't have to be slow or frustrating. With MACg's powerful image generator, flexible slide builder, and the prompt templates in this guide, you can turn dense clinical or scientific data into clear, professional visuals that work on the first few iterations—not the tenth.
From Evidence to Publication-Ready Content—Faster
MACg brings research, writing, citations, visuals, and presentations together in one Evidence-First AI workspace.

100 AI Slide Presentation Prompts for Busy Medical and Scientific Professionals
This article provides 100 ready‑to‑use AI prompts to help medical and scientific professionals create high‑quality slide presentations with MACg. The prompts are organized into practical categories, including clinical education, drug and mechanism‑of‑action decks, PubMed‑driven evidence reviews, specialty teaching, medical affairs and HEOR, training and curriculum, data‑visualization, and conference or grant presentations. Each prompt uses clear “Instruction:” wording and customizable placeholders (e.g., [condition], [audience], [timeframe]) so users can quickly adapt them to their specific topic and setting. By removing blank‑slide paralysis, the collection speeds up evidence‑based slide creation while supporting consistent, structured, and compliant communication.

Feb 4, 2026

10 Tips For Using MACg and Other AI Solutions For Medical and Scientific Writing
This article shares 10 practical tips for medical writers, pharma/biotech professionals, HCPs, and researchers on how to use MACg and other AI solutions effectively and responsibly. It emphasizes that MACg's AI agent training knowledge is not a citable evidence base and must be anchored in real, verifiable sources such as publications, CSRs, labels, guidelines, and internal documents. Readers are encouraged to treat all AI outputs as Version 0.1, iterating with expert review rather than accepting the first draft. The article frames MACg as a drafting and thinking assistant, not an autonomous author, and stresses the importance of clear prompts about audience, purpose, region, timeframe, and scope. It recommends breaking complex projects into smaller tasks, using MACg to improve structure and clarity, and explicitly asking for limitations and caveats. Finally, it advocates creating institutional checklists and making expert human review and sign‑off mandatory for any impactful content.
Mar 1, 2026
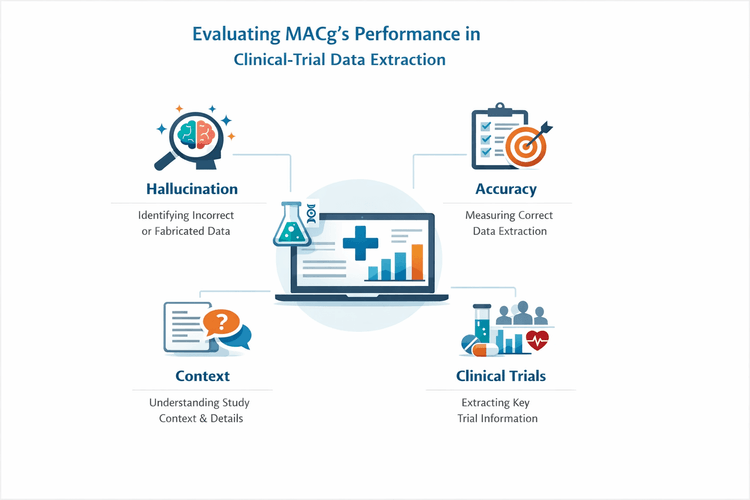
Reliability of MACg for Source‑Aligned Clinical‑Trial Data Extraction: Hallucination, Accuracy, and Contextual Understanding
We evaluated MACg, a GPT–5–based writing and research assistant, for medical writing and data extraction, on five uploaded clinical‑trial PDFs (15 questions per study; 75 total). Questions on design, endpoints, efficacy, safety, limitations, and interpretation were asked one at a time, without instructions to avoid hallucinations or rely on the document. A clinician compared each answer with the source. MACg demonstrated zero hallucinations, 100% accuracy for requested data, contextual integration across sections, appropriate handling of missing information, and clinically coherent interpretation grounded in the trials, supporting its use for reliable, source‑aligned medical communication.

Feb 14, 2026